We created a versioning system to help tackle the primary goal and numerous challenges.
\nThe client wanted to display the most recent year of data. To accomplish this, we needed to review all imported data, extract the latest information, and then present that on the front-end charts and graphs. However, this was a resource-heavy process and wasn't prudent for every request. To alleviate the load on the server, we developed a database structure to store both raw imported data and presentable frontend data.
\nThis allowed us to streamline data retrieval and optimize performance, automatically updating frontend data whenever new information was imported, ensuring that users always had access to the latest insights.
"},{"color":"orange","heading":"Data Import","icon":"arrow-up-on-square-stack","span":"lg:row-span-1","sub_heading":"Challenge","text":"The client provided raw CSV files, prompting collaboration with the data team to establish a mutually compatible format. After importing the data, we combined crucial information to generate unique keys for each data row. This facilitated the uploading of slightly modified data, ensuring that any changes would overwrite existing entries without duplication.
"},{"color":"green","heading":"Bonus","icon":"eye","span":"lg:row-span-1","sub_heading":"Challenge","text":"Creation of the database structure for raw and presentable frontend data enabled the implementation of a previewable URL without impacting production data during imports. This approach ensured seamless data deployment with zero downtime.
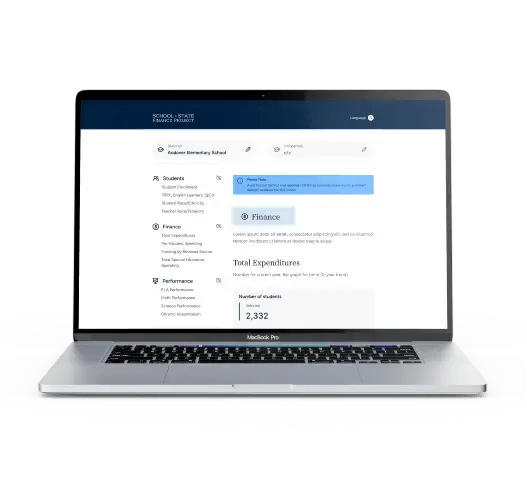
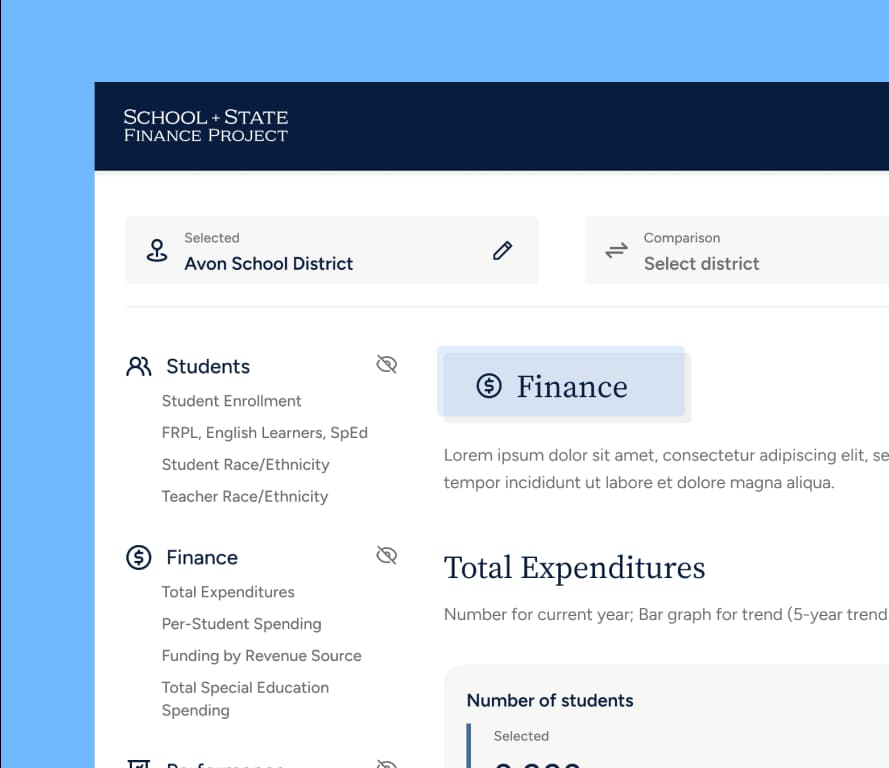
"}],"media":{"enabled":true,"heading":"Version System","image":{"alt":"header (1)","height":401,"max_height":401,"max_width":1141,"size_type":"auto_custom_max","src":"https://19620338.fs1.hubspotusercontent-na1.net/hubfs/19620338/header%20(1).jpg","width":1141}}}In our UX design, we prioritized the visibility and clarity of the latest dataset. It was crucial for users to easily identify the specific year associated with each metric. We also implemented this feature in a subtle and non-intrusive manner, enhancing the user experience while delivering key insights.
"},{"color":"orange","heading":"Download Data","icon":"arrow-down-on-square-stack","span":"lg:row-span-1","sub_heading":"Challenge","text":"We collaborated with the client to identify the key data points for inclusion in the PDF downloads. We then crafted a meticulously formatted document that aligns seamlessly with their brand aesthetics.
"}],"media":{"enabled":true,"heading":"UI, UX & design","image":{"alt":"header (3) (1)","height":400,"max_height":400,"max_width":1140,"src":"https://19620338.fs1.hubspotusercontent-na1.net/hubfs/19620338/header%20(3)%20(1).jpg","width":1140}}}Enabling data downloads posed challenges, especially considering the inclusion of data charts. To address this, we developed an HTML template to dynamically generate printable PDFs, incorporating data retrieved from the database. Leveraging the extensibility of Chart.js, we produced images of specific charts for integration into the PDFs.
\nRecognizing the resource-intensive nature of this process, we implemented the following steps:
\n- \n
- Upon initial request for a specific district or school, we generate the PDF. \n
- We dynamically generate graph images and gather data. \n
- The resulting PDF is saved on the server. \n
- Users are then redirected to access the PDF. \n
By following this approach, subsequent requests are instantaneous, ensuring optimal server performance without overload.
"},{"color":"orange","heading":"Translation","icon":"language","span":"lg:row-span-1","sub_heading":"Challenge","text":"To accommodate the application's translation into four languages, the downloadable PDFs also required translation. To handle this, we implemented a system to detect the user's language and generate PDFs accordingly. However, this solution introduced an additional challenge, unrelated to our initial design
"},{"color":"green","heading":"Bonus","icon":"eye","span":"lg:row-span-1","sub_heading":"Challenge","text":"As we were creating static PDF files, representing a \"snapshot\" of data at a specific time, this meant that once the data was updated, previously generated PDFs became obsolete.
\nTo address this, we utilized the Versioning System:
\n- \n
- Each new version received a unique identifier. \n
- We prefixed the PDF file with the unique identifier \n
- When a PDF for a district/school was requested, we checked if the current version of the PDF existed, and if it did, we provided it; otherwise, we generated a new one. \n
This approach ensured that all download requests provided users with the most up-to-date data available.
"}],"media":{"enabled":true,"heading":"Print to PDF","image":{"alt":"header (4)","height":800,"max_height":701.7543859649122,"max_width":2000,"size_type":"auto_custom_max","src":"https://19620338.fs1.hubspotusercontent-na1.net/hubfs/19620338/header%20(4).jpg","width":2280}}}.jpg?width=1141&height=401&name=header%20(1).jpg)
Version System
Challenge
Data Availability
We created a versioning system to help tackle the primary goal and numerous challenges.
The client wanted to display the most recent year of data. To accomplish this, we needed to review all imported data, extract the latest information, and then present that on the front-end charts and graphs. However, this was a resource-heavy process and wasn't prudent for every request. To alleviate the load on the server, we developed a database structure to store both raw imported data and presentable frontend data.
This allowed us to streamline data retrieval and optimize performance, automatically updating frontend data whenever new information was imported, ensuring that users always had access to the latest insights.
Challenge
Data Import
The client provided raw CSV files, prompting collaboration with the data team to establish a mutually compatible format. After importing the data, we combined crucial information to generate unique keys for each data row. This facilitated the uploading of slightly modified data, ensuring that any changes would overwrite existing entries without duplication.
Challenge
Bonus
Creation of the database structure for raw and presentable frontend data enabled the implementation of a previewable URL without impacting production data during imports. This approach ensured seamless data deployment with zero downtime.
%20(1).jpg?width=1140&height=400&name=header%20(3)%20(1).jpg)
UI, UX & design
Challenge
Data Availability
In our UX design, we prioritized the visibility and clarity of the latest dataset. It was crucial for users to easily identify the specific year associated with each metric. We also implemented this feature in a subtle and non-intrusive manner, enhancing the user experience while delivering key insights.
Challenge
Download Data
We collaborated with the client to identify the key data points for inclusion in the PDF downloads. We then crafted a meticulously formatted document that aligns seamlessly with their brand aesthetics.
.jpg?width=2000&name=header%20(4).jpg)
Print to PDF
Challenge
Download Data
Enabling data downloads posed challenges, especially considering the inclusion of data charts. To address this, we developed an HTML template to dynamically generate printable PDFs, incorporating data retrieved from the database. Leveraging the extensibility of Chart.js, we produced images of specific charts for integration into the PDFs.
Recognizing the resource-intensive nature of this process, we implemented the following steps:
- Upon initial request for a specific district or school, we generate the PDF.
- We dynamically generate graph images and gather data.
- The resulting PDF is saved on the server.
- Users are then redirected to access the PDF.
By following this approach, subsequent requests are instantaneous, ensuring optimal server performance without overload.
Challenge
Translation
To accommodate the application's translation into four languages, the downloadable PDFs also required translation. To handle this, we implemented a system to detect the user's language and generate PDFs accordingly. However, this solution introduced an additional challenge, unrelated to our initial design
Challenge
Bonus
As we were creating static PDF files, representing a "snapshot" of data at a specific time, this meant that once the data was updated, previously generated PDFs became obsolete.
To address this, we utilized the Versioning System:
- Each new version received a unique identifier.
- We prefixed the PDF file with the unique identifier
- When a PDF for a district/school was requested, we checked if the current version of the PDF existed, and if it did, we provided it; otherwise, we generated a new one.
This approach ensured that all download requests provided users with the most up-to-date data available.
“Ever Wonder’s collaborative process, attention to detail, and exceptional project management ensured the new app was launched on schedule and set up for success.”

Scope
Before starting the project, detailed scoping is conducted to define deliverables, anticipate potential issues, and provide accurate pricing estimates
.svg)
Project Planning
Key stages (milestones), important tasks, and client meetings are mapped out, resulting in a Gantt Chart of the project timeline.
.svg)
Client Kick-off
A meeting is held with the client to introduce key team members and present the project timeline.
.svg)
UX (User Experience)
Significant time is dedicated to mapping out application structure, user experience, and user navigation. Feedback from the client is sought continuously to ensure rapid iteration.
.svg)
Design
Once the UX is finalized, branding is layered over the UX. The thorough UX phase facilitates a smoother design implementation.
.svg)
Development
Backend work begins early, allowing for concurrent progress with design. Frontend visuals are coded once designs are approved.
.svg)
Beta Testing
Community users participate in beta testing, providing valuable usability feedback.
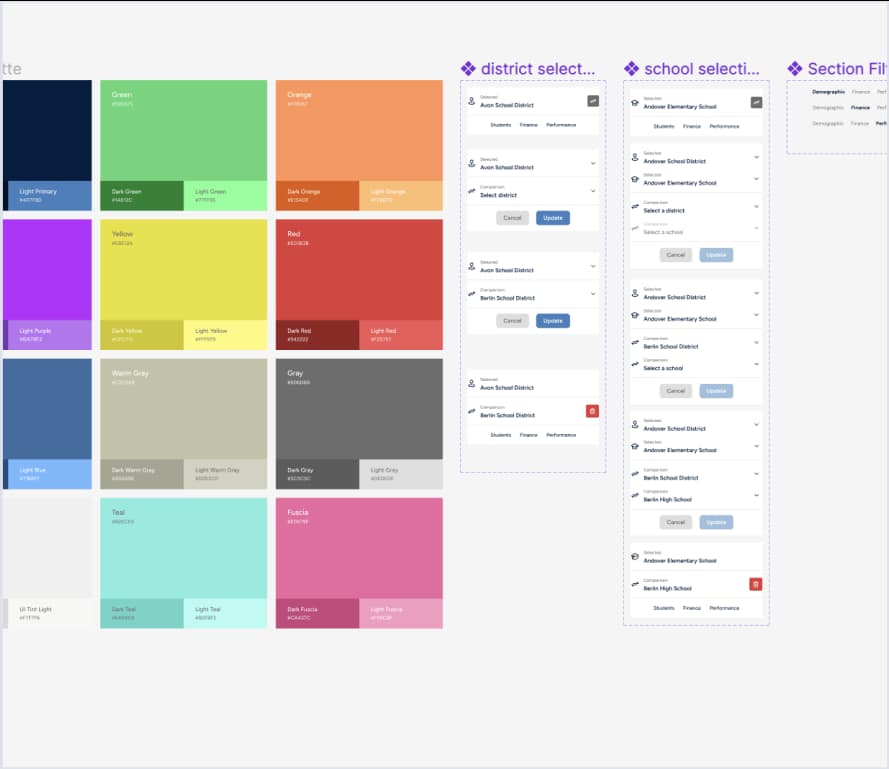
Design System
Using Figma, we created a fresh new design system by revitalizing existing core brand elements and bringing them up to date. We utilized Tailwind CSS for an API-driven design system and configured Figma to work well with it. This kept all designs and UI elements consistent and on-brand at all times, enforcing type, color, and spacing constraints.

Chart.js
As this was a data-heavy project, we made use of the Chart.js plugin. It's extremely powerful and extensible, and we were delighted with our choice. It enabled us to accomplish all our goals, integrate into the application, allow for custom work, provide a great user experience, and reduce development time by utilizing such a robust framework.
Reactive Frontend
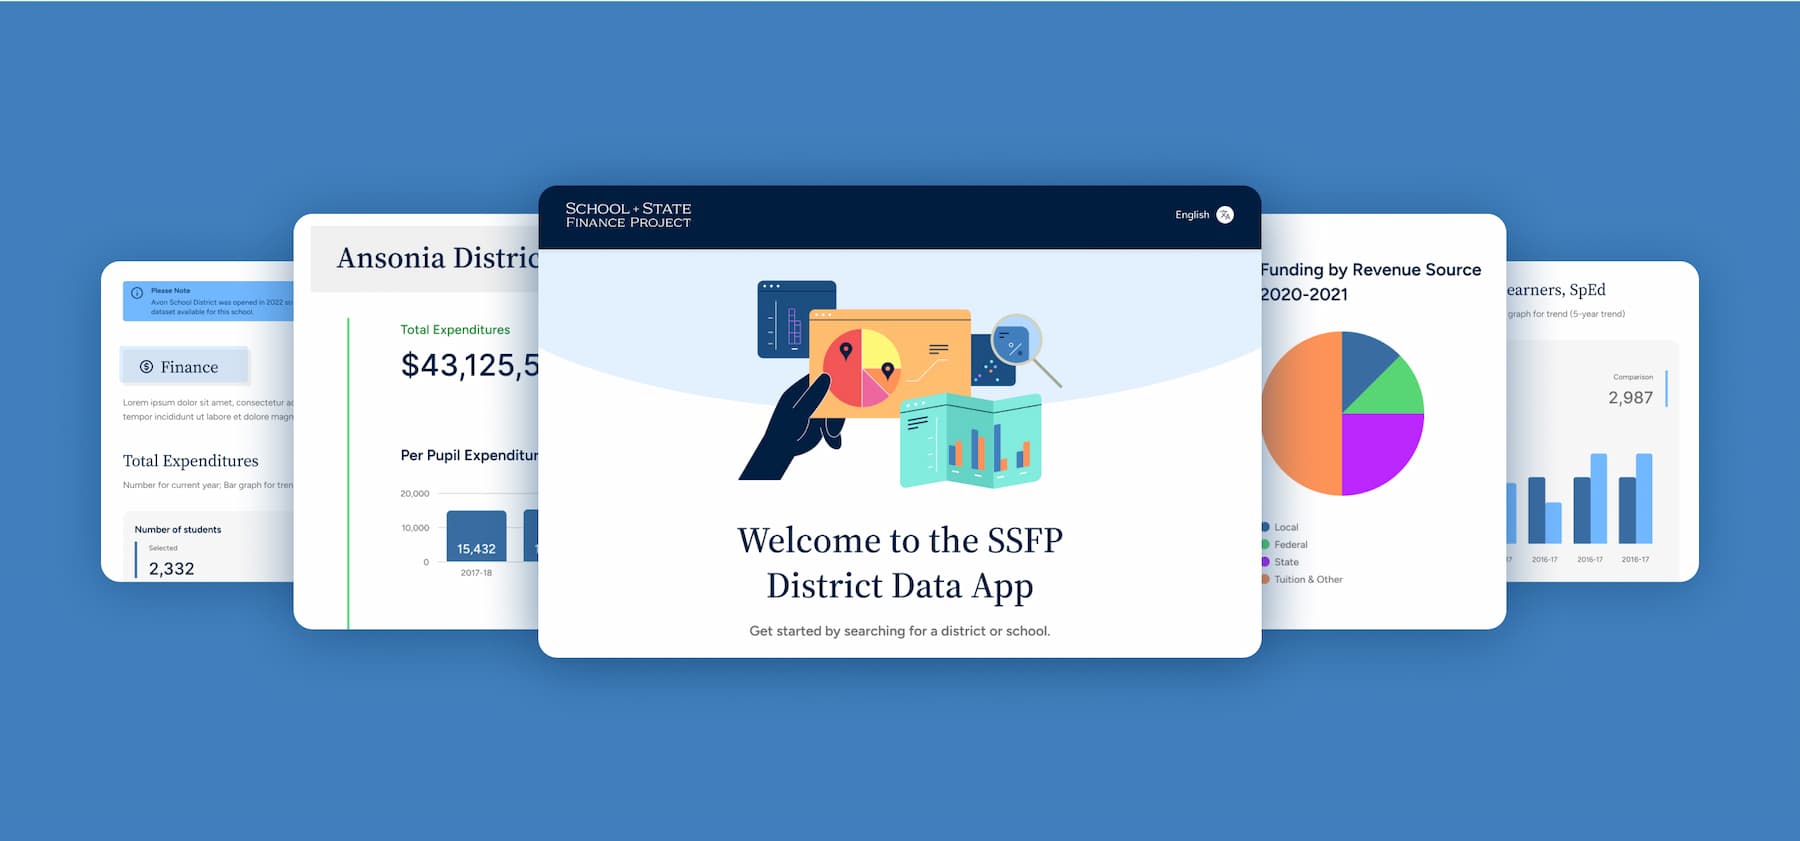
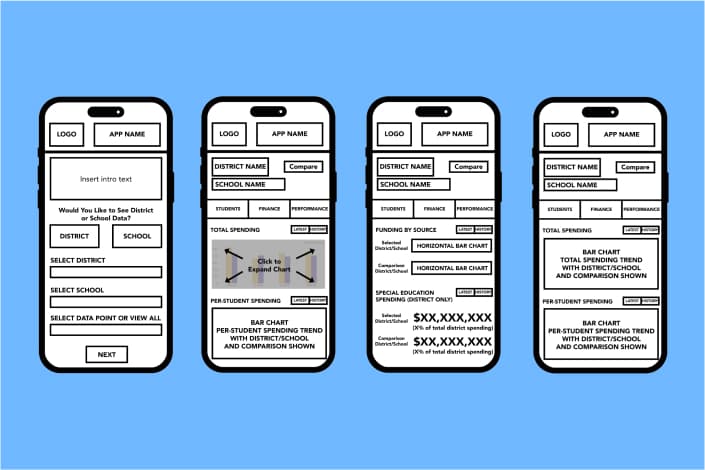
The core requirement was to allow users to be able to compare data between two Districts or two Schools. To make this happen, we created an intuitive user interface (UI) that allows multiple datasets to be requested, updates frontend UI elements on the fly, and ensures good SEO practices.
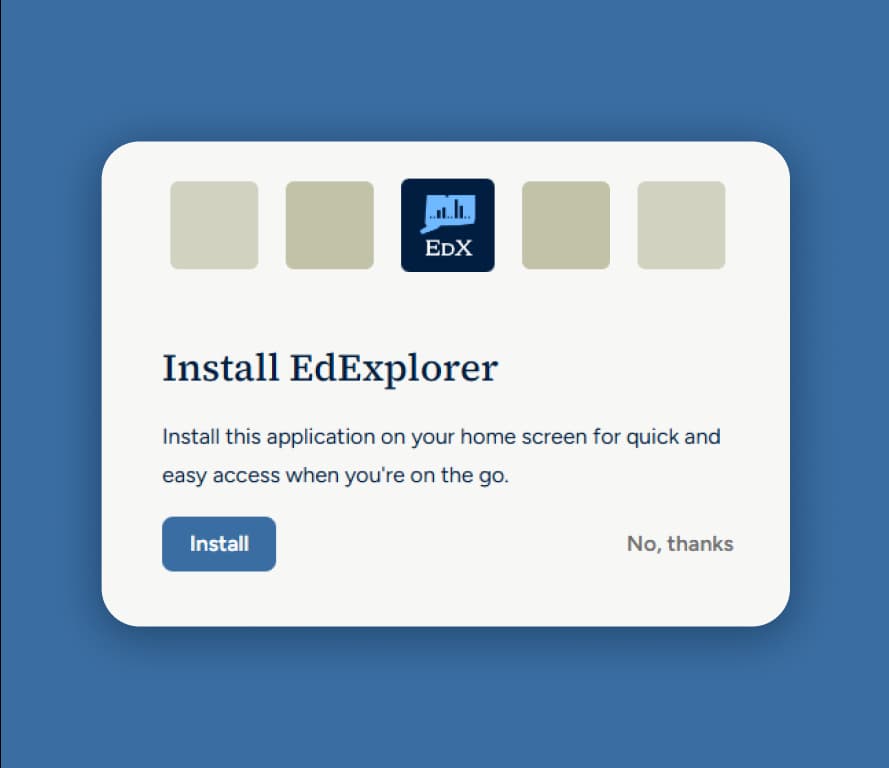
Progressive Web Application (PWA)
One key piece of user feedback was the desire to "install" the application onto their phones. As it wasn't in scope or budget to create a fully native iOS or Android application, we landed on a Progressive Web Application, which allows users to "save" the application to their phone start screen for easy access.


.jpg?width=548&height=470&name=Mockup%20(1).jpg)
.jpg?width=1710&height=705&name=Color%20Palette%20(1).jpg)

.svg)
.webp?width=393&height=470&name=PDF-GIF%20(1).webp)
.jpg?width=1140&height=771&name=Phone%20Screens%20(1).jpg)

.jpg?width=705&height=470&name=iPad%20Mockup%20(1).jpg)